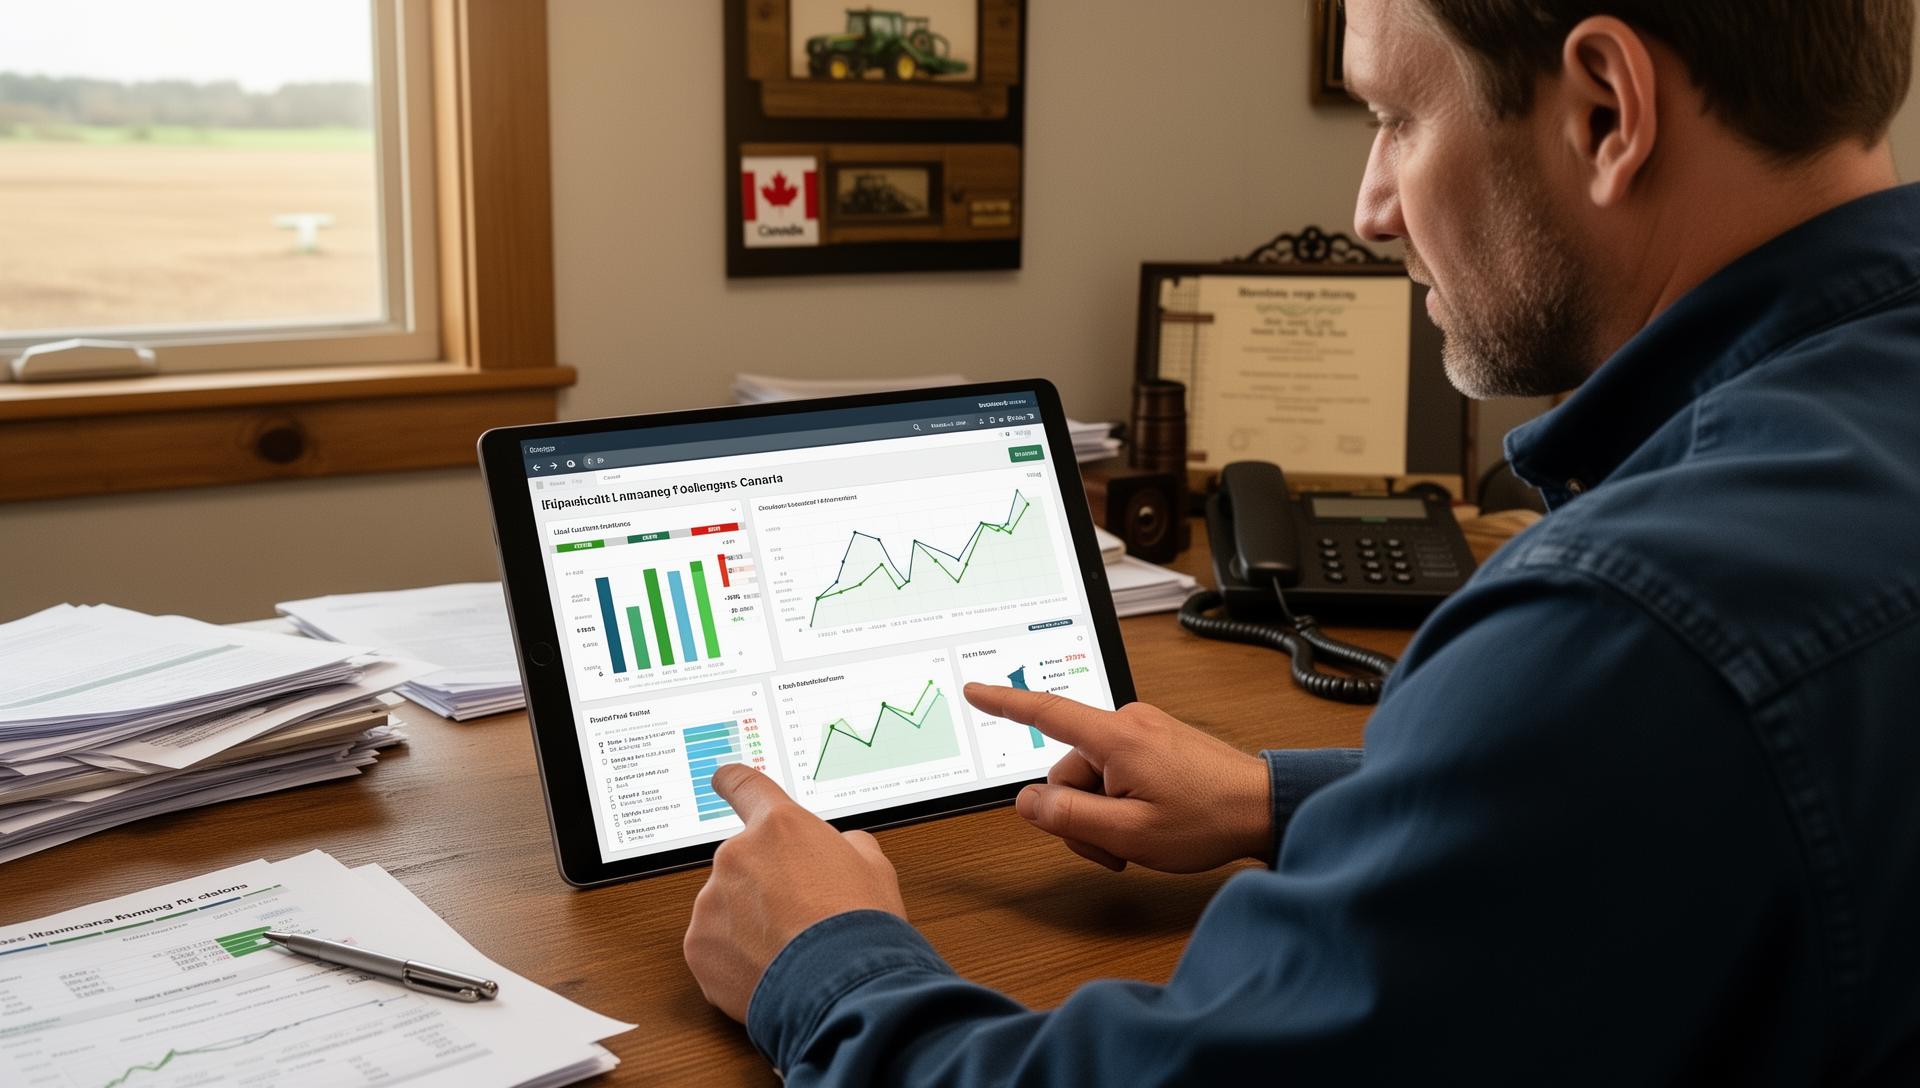
In modern agriculture, gut feeling and tradition aren't enough—profitable farms are increasingly data-driven operations that measure everything, analyze trends, benchmark performance, and make decisions based on evidence rather than assumptions. Canadian farms collecting and analyzing data report higher profitability, better risk management, and more confident decision-making than those relying solely on experience.
Why Data-Driven Farm Management Increases Profitability
Key benefits of data-driven farming:
- Moving from intuition to evidence-based decisions
- Identifying hidden profit leaks in operations
- Optimizing resource allocation across enterprises
- Better timing of marketing decisions
- Risk identification and proactive management
- Benchmarking for continuous improvement
- Documentation for lenders and investors
Essential Farm Financial Metrics
Profitability Metrics
Key financial indicators to track:
- Net farm income (total and per acre)
- Return on Assets (ROA)
- Return on Equity (ROE)
- Operating profit margin
- Gross margin by enterprise
- Working capital
- Debt-to-asset ratio
- Current ratio (liquidity)
Production Metrics
Operational metrics that drive profit:
- Yield by field/crop
- Input costs per acre (seed, fertilizer, chemicals, fuel)
- Labour efficiency (acres per hour, cost per acre)
- Equipment costs (ownership and operation)
- Livestock metrics (feed conversion, weaning weights)
- Quality measurements (protein, grade)
Enterprise Analysis and Cost of Production
Breaking down your farm by enterprise (wheat, canola, cattle, etc.) reveals which parts of your operation truly make money. Accurate cost allocation—including land costs, inputs, equipment, and overhead—enables you to rank enterprises by contribution margin and return on investment.
Field-Level and Zone Analysis
Profitability varies dramatically by field and even by zones within fields. Identifying consistently high-performing fields and investigating underperforming areas leads to better management decisions. Match inputs to productivity zones for optimal returns.
Input Optimization Through Data
Optimize major input categories:
- Fertilizer: cost per unit of nutrient, response curves, optimal application rates
- Seed: cost vs. yield performance, variety trials, population optimization
- Chemicals: cost-benefit analysis, threshold-based application, generic vs. brand
Marketing Performance Analysis
Track your average price received versus market averages, analyze forward contract performance, and evaluate storage decisions. Historical analysis of marketing timing reveals optimal windows and helps improve future decisions.
Benchmarking Farm Performance
Compare your yields, costs of production, and profitability against regional averages and top performers. What do the top 25% of farms do differently? Benchmarking resources include Agriculture and Agri-Food Canada data, provincial statistics, and farm management associations.
Scenario Planning and Cash Flow Forecasting
Model different crop mix scenarios, price sensitivity, and cost changes. Monthly cash flow projections identify seasonal patterns, potential shortfalls, and credit line needs. Plan marketing decisions around cash requirements.
How AgriIntel Maximizes Farm Profitability
Platform profitability features:
- Comprehensive financial and operational dashboards
- Automated enterprise profitability analysis
- Cost of production calculator by crop/field
- Input efficiency tracking and benchmarking
- Field-level profit mapping
- Marketing performance analytics
- Multi-year trend analysis and visualization
- Scenario planning and "what if" modeling
- Cash flow forecasting
- Integration with accounting software
Stop guessing and start knowing with AgriIntel's profit optimization tools. Start your free 14-day trial and discover where your next profit improvements are hiding.
Get Started Free